KPI model and metric dictionary
Shared formulas and ownership so every team reads the same numbers.
Stop arguing about numbers. I build dashboards that pull data from your tools, standardize definitions, and give each role a clear view of what matters.
Every dashboard build includes the data foundation, interface, and operational controls needed for long-term trust.
Shared formulas and ownership so every team reads the same numbers.
Connected APIs, databases, and sheets with reliable refresh logic.
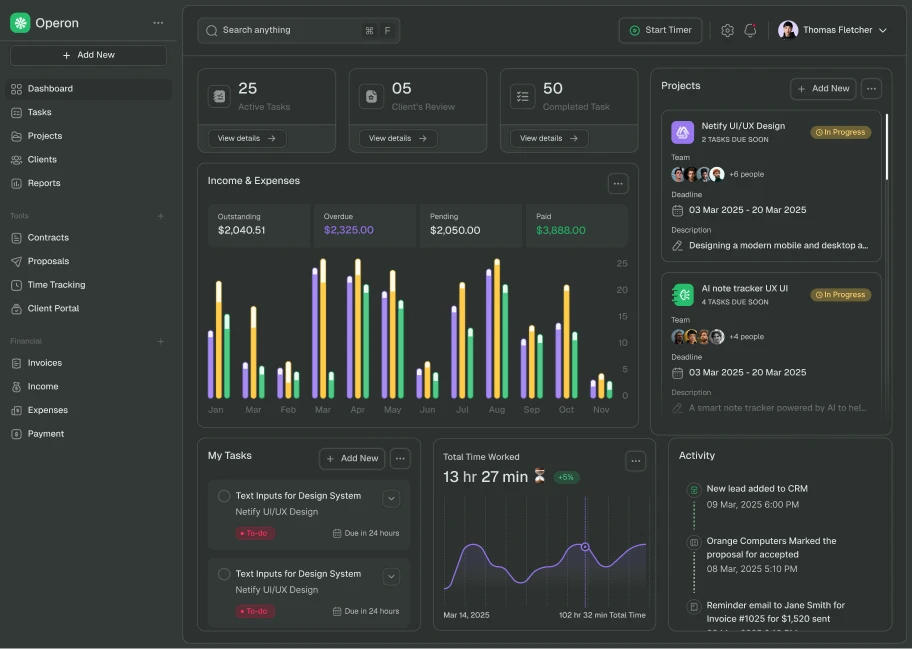
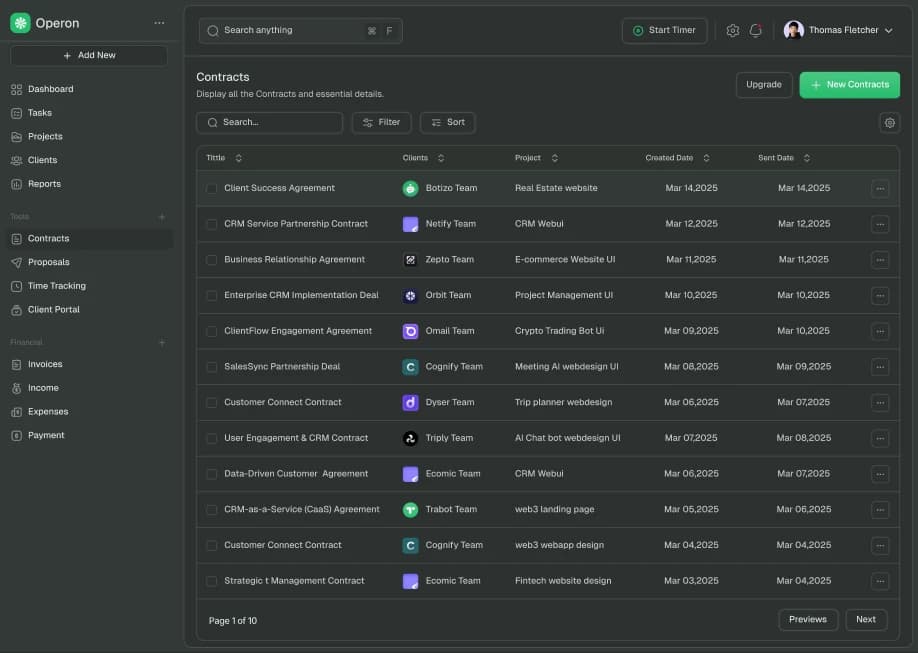
Tailored screen layouts for leadership, operations, and execution teams.
Click from top-level KPI to root-cause views and action-ready details.
Access boundaries and activity visibility where sensitive data is involved.
Monitoring plus clear guidance so reporting remains trusted after launch.
Your KPIs live across multiple tools and spreadsheets.
Reporting takes hours and breaks at the end of each month.
Different teams use different definitions for the same number.
Leadership asks for updates because visibility is fragmented.
You only need a one-off static report, not ongoing tracking.
There is no data owner to validate metric definitions.
The blocker is purely legal or procurement, not reporting clarity.
Start with the decision your team needs most, then expand using the same data model and design system.
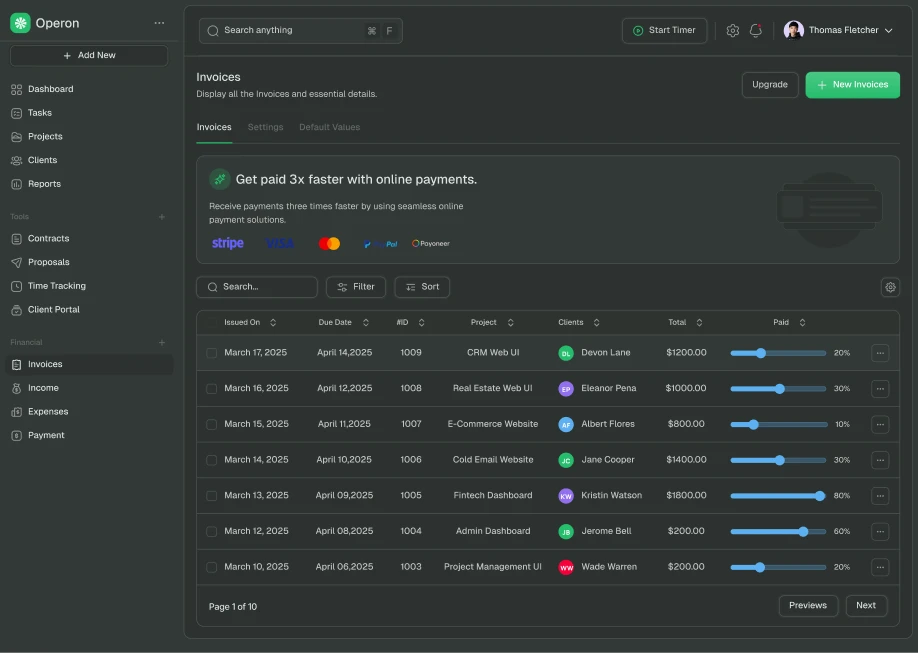
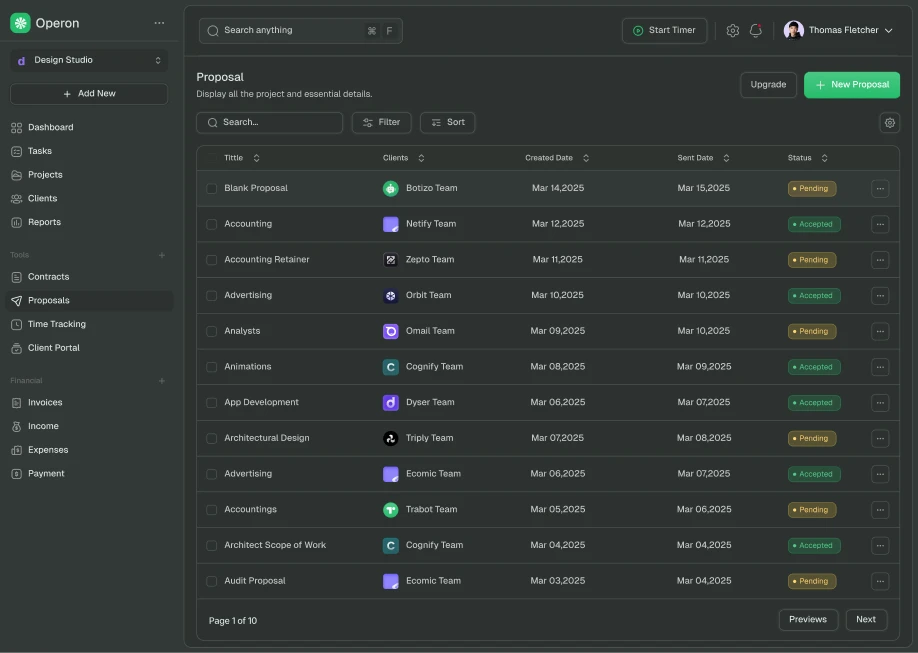
Revenue and forecast visibility
Track conversion stages, deal velocity, win rates, and forecast confidence in one view.
Throughput and execution health
Monitor workload, cycle times, blocked tasks, and SLA breaches before they become firefighting.
Margins, burn, and runway
Connect billing and finance data for a practical view of cash, margin trends, and commitments.
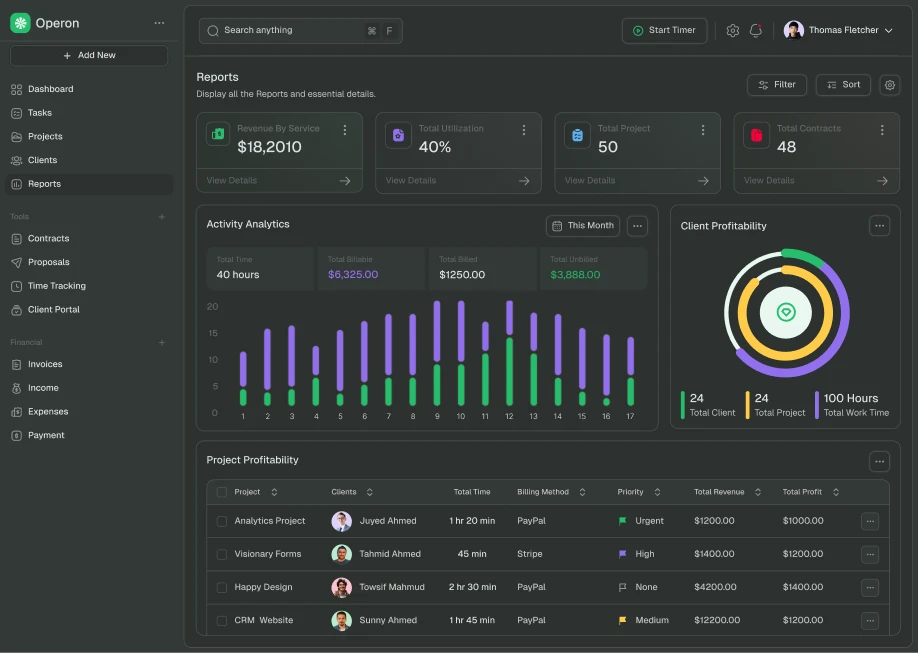
Retention and account risk
Give CS teams one place for health scoring, churn signals, renewal timelines, and account actions.
The process moves from data truth to adoption, so the dashboard works in day-to-day decisions.
Phase 1
Inventory sources, define metric formulas, and agree on the minimum viable dashboard.
Phase 2
Map screen hierarchy, drill-down flows, and role-specific views with real stakeholder feedback.
Phase 3
Connect data, implement dashboard UI, and add permissions, monitoring, and quality checks.
Phase 4
Roll out with documentation, team onboarding, and a roadmap for monthly improvements.
Definitions are stable across teams and reports.
Roles and permissions match real ownership boundaries.
Start with a focused dashboard build or keep a monthly partnership for ongoing reporting and integration needs.
Best for one clearly defined dashboard, internal tool, or website launch with a clear deliverable and limited integrations.
Best for teams that want ongoing improvements, automations, and iteration without new contracts each time.
Questions about integrations, access control, delivery pace, and keeping dashboard metrics reliable after launch.
A first dashboard release can often ship in a few weeks when the key metrics and data sources are clear. More complex rollouts depend on data cleanup, source alignment, and role-specific views.
Pricing includes metric definition, data mapping, dashboard design and build, quality checks, and rollout support. Cost depends on source complexity, transformation work, and number of role-specific views.
Yes, when it fits your workflow and constraints. I can work with tools like Looker, Metabase, and Power BI, or build a custom dashboard when you need role-specific workflows and tighter integration.
That is common. We start with source-of-truth mapping and KPI definitions, then clean and normalize inputs before we optimize visuals. Reliability comes before polish.
We design access by role from the start, so each team sees only the metrics and records they should access. For sensitive workflows, we add row-level restrictions and audit visibility where needed.
Adoption is part of delivery: role-specific views, clear KPI definitions, practical drill-downs, and onboarding guidance. If people cannot use it in weekly decisions, it is not done.
We need your key decisions, current reports, source access context, and metric owners. This lets us align definitions early and avoid rework during implementation.
We review metric health, data freshness, and user adoption regularly. If sources or definitions change, we update logic and documentation so decisions stay based on trusted numbers.
Share your current reporting workflow and data sources. I will tell you what is realistic and what the fastest path looks like.